RSI(2) with Position Sizing
Though it’s more than two weeks later, here’s the second post in the series that will demonstrate how to build, test, and implement a trading strategy with R. You can find the first post here.
The first post replicated this simple RSI(2) strategy from the MarketSci Blog. This second post will demonstrate how to replicate this strategy that scales in/out of RSI(2).
A couple notes before moving to the code:
The
rsi2pos()function isn’t necessary, but it provides an example of how to define a function. Plus, it enables us to test several ideas with much greater speed and flexibility.The
ifelse()function works on entire vectors at once, avoiding costly loops (loops are costly in R because it’s an interpreted language). Since we can potentially modify the entire ‘size’ vector, we must be mindful of the order of the tests.
On to the code!
# Attach the quantmod and TTR packages.
# You can install packages via:
# install.packages(c("quantmod","TTR"))
library(quantmod)
library(TTR)

# Pull S&P500 index data from Yahoo! Finance
getSymbols("^GSPC", from="2000-01-01", to="2008-12-07")

# Calculate the RSI indicator
rsi <- RSI(Cl(GSPC),2)

# Calculate Close-to-Close returns
# (this assumes we open/close our positions
# at each day's close)
ret <- ROC(Cl(GSPC))
ret[1] <- 0

# Define our position-sizing function
rsi2pos <- function(ind, indIncr=5, posIncr=0.25) {
# Inputs:
# ind : indicator vector
# indIncr : indicator value increments/breakpoints
# posIncr : position value increments/breakpoints

# Initialize result vector
size <- rep(0,NROW(ind))

# Long
size <- ifelse(ind < 4*indIncr, (1-posIncr*3), size)
size <- ifelse(ind < 3*indIncr, (1-posIncr*2), size)
size <- ifelse(ind < 2*indIncr, (1-posIncr*1), size)
size <- ifelse(ind < 1*indIncr, (1-posIncr*0), size)

# Short
size <- ifelse(ind > 100-4*indIncr, 3*posIncr-1, size)
size <- ifelse(ind > 100-3*indIncr, 2*posIncr-1, size)
size <- ifelse(ind > 100-2*indIncr, 1*posIncr-1, size)
size <- ifelse(ind > 100-1*indIncr, 0*posIncr-1, size)

# Today's position ('size') is based on today's
# indicator, but we need to apply today's position
# to the Close-to-Close return at tomorrow's close.
size <- lag(size)

# Replace missing signals with no position
# (generally just at beginning of series)
size[is.na(size)] <- 0

# Return results
return(size)
}

# Calculate signals using the 'rsi2pos()' function
sig <- rsi2pos(rsi, 5, 0.25)

# Break out the long (up) and short (dn) signals
sigup <- ifelse(sig > 0, sig, 0)
sigdn <- ifelse(sig < 0, sig, 0)

# Calculate equity curves
eq_up <- exp(cumsum(ret*sigup))
eq_dn <- exp(cumsum(ret*sigdn))
eq_all <- exp(cumsum(ret*sig))

# Replicate Michael's nice chart (again)
png(filename="20090430_rsi2_replication.png")
plot.zoo( cbind(eq_up, eq_dn), plot.type="single",
ylab=c("Long","Short"), col=c("green","red"),
main="RSI(2) Strategy, with Position Scaling:\n 2000-01-03 through 2008-12-07" )
dev.off()
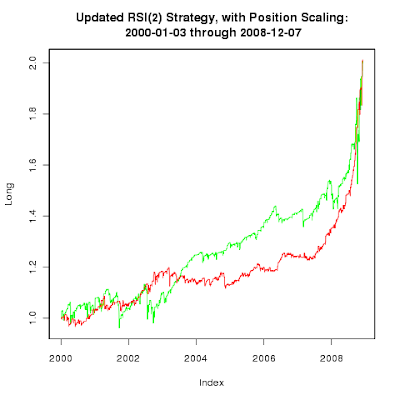 Visual inspection of the charts seems to indicate the updated RSI(2) strategy has slightly higher returns, but more volatility and larger drawdowns.
The PerformanceAnalytics package can evaluate the volatility, drawdowns, and related metrics for investing and trading strategies. We’ll use it in the next post to evaluate RSI(2).
If you love using my open-source work (e.g. quantmod, TTR, xts, IBrokers, microbenchmark, blotter, quantstrat, etc.), you can give back by sponsoring me on GitHub. I truly appreciate anything you’re willing and able to give!