Testing RSI(2) with R, First Steps
This is the first of a series of posts that will demonstrate how to build, test, and implement a trading strategy using my favorite FOSS, R. I chose the RSI(2) strategy because it has gotten considerable attention on trading blogs over the past 6 months.
In particular, I will be replicating and extending some of the results from Michael Stokes’ excellent MarketSci Blog. This post will focus on replicating this simple RSI(2) strategy.
Without further ado, let’s get to some code…
# We will need the quantmod package for charting and pulling
# data and the TTR package to calculate RSI(2).
# You can install packages via: install.packages("packageName")
# install.packages(c("quantmod","TTR"))
library(quantmod)
library(TTR)
# Pull S&P500 index data from Yahoo! Finance
getSymbols("^GSPC", from="2000-01-01", to="2008-12-07")
# Calculate the RSI indicator
rsi <- RSI(Cl(GSPC),2)
# Create the long (up) and short (dn) signals
sigup <- ifelse(rsi < 10, 1, 0)
sigdn <- ifelse(rsi > 90, -1, 0)
# Lag signals to align with days in market,
# not days signals were generated
#sigup <- Lag(sigup,1) # Use lag() to avoid Toby's error
#sigdn <- Lag(sigdn,1) # Use lag() to avoid Toby's error
sigup <- lag(sigup,1) # Note k=1 implies a move *forward*
sigdn <- lag(sigdn,1) # Note k=1 implies a move *forward*
# Replace missing signals with no position
# (generally just at beginning of series)
sigup[is.na(sigup)] <- 0
sigdn[is.na(sigdn)] <- 0
# Combine both signals into one vector
sig <- sigup + sigdn
# Calculate Close-to-Close returns
ret <- ROC(Cl(GSPC))
ret[1] <- 0
# Calculate equity curves
eq_up <- exp(cumsum(ret*sigup))
eq_dn <- exp(cumsum(ret*sigdn*-1))
eq_all <- exp(cumsum(ret*sig))
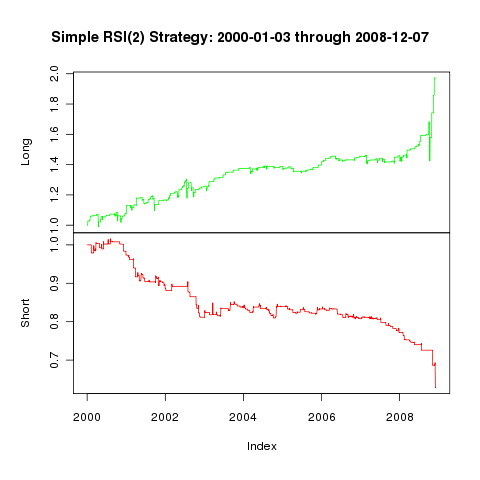
# Replicate Michael's nice chart
plot.zoo( cbind(eq_up, eq_dn),
ylab=c("Long","Short"), col=c("green","red"),
main="Simple RSI(2) Strategy: 2000-01-02 through 2008-12-07" )
# Wait a few seconds before making next chart…
#Sys.sleep(5)
# Create a chart showing the S&P500
#chartSeries(GSPC, type="line")
# Add the total equity line
#addTA(eq_all)
My version of Michael’s chart is below. Up next, scaling in/out of positions with RSI(2).
 Now, let’s look at RSI(2) with position sizing.
If you love using my open-source work (e.g. quantmod, TTR, xts, IBrokers, microbenchmark, blotter, quantstrat, etc.), you can give back by sponsoring me on GitHub. I truly appreciate anything you’re willing and able to give!