Stack Financials: Analyze Financial Statement Data
A quantmod user asked an interesting question on StackOverflow: Looping viewFinancials from quantmod. Basically, they wanted to create a data.frame that contained financial statement data for several companies for several years. I answered their question, and thought others might find the function I wrote useful… hence, this post!
I called the function stackFinancials() because it would use getFinancials() and viewFinancials() to pull financial statement data for multiple symbols, and stack them together in long form. I chose a long data format because I don’t know whether the output of viewFinancials() always has the same number of rows and columns for a given type and period. The long format makes it easy to put all the data in one object.
stackFinancials <-
function(symbols, type = c("BS", "IS", "CF"), period = c("A", "Q")) {
  # Ensure the type and period arguments match viewFinancials
  type <- match.arg(toupper(type[1]), c("BS", "IS", "CF"))
  period <- match.arg(toupper(period[1]), c("A", "Q"))

  # Simple function to get financials for one symbol
  getOne <- function(symbol, type, period) {
    gf <- getFinancials(symbol, auto.assign = FALSE)
    vf <- viewFinancials(gf, type = type, period = period)
    # Put viewFinancials output into a data.frame
    df <- data.frame(vf, line.item = rownames(vf), type = type,
                     period = period, symbol = symbol,
                     stringsAsFactors = FALSE, check.names = FALSE)
    # Reshape data.frame into long format
    long <- reshape(df, direction="long", varying=seq(ncol(vf)),
                    v.names="value", idvar="line.item",
                    times=colnames(vf))
    # Reset row.names to "automatic"
    rownames(long) <- NULL
    # Return data
    long
  }
  # Loop over all symbols
  allData <- lapply(symbols, getOne, type = type, period = period)
  # rbind() all into one data.frame
  do.call(rbind, allData)
}
Here’s a simple example of how to use stackFinancials() to pull the quarterly (period = "Q") income statements (type = "IS") for General Electric and Apple:
library(quantmod)
Data <- stackFinancials(c("GE", "AAPL"), type = "IS", period = "Q")
head(Data, 4)
##                line.item type period symbol       time value
## 1                Revenue   IS      Q     GE 2016-12-31 33088
## 2   Other Revenue, Total   IS      Q     GE 2016-12-31    NA
## 3          Total Revenue   IS      Q     GE 2016-12-31 33088
## 4 Cost of Revenue, Total   IS      Q     GE 2016-12-31 24775
Now that we have the output in Data, let’s do something with it. You could simply subset Data to extract the components you want. For example, if you wanted to look at Apple’s quarterly revenue, you could subset Data where symbol == "AAPL" and line.item == "Total Revenue". But if you’re going to slicing-and-dicing a lot, it can often help to write a general function to simplify things. So I wrote extractLineItem(). It takes the output of stackFinancials() and a regular expression of the line item you want, and it returns an xts object that contains the given line items for all symbols in the data.
extractLineItem <- function(stackedFinancials, line.item) {
  if (missing(stackedFinancials) || missing(line.item)) {
    stop("You must provide output from stackFinancials(),",
         "and the line.item to extract")
  }
  # Select line items matching user input
  match.rows <- grepl(line.item, Data$line.item, ignore.case = TRUE)
  sfSubset <- Data[match.rows,]
  getItem <- function(x) {
    # Create xts object
    output <- xts(x$value, as.yearmon(x$time))
    # Ensure column names are syntactically valid
    valid.names <- make.names(paste(x$symbol[1], x$line.item[1]))
    # Remove repeating periods
    colnames(output) <- gsub("\\.+", "\\.", valid.names)
    output
  }
  # Split subset by line.item and symbol
  symbol.item <- split(sfSubset, sfSubset[, c("symbol", "line.item")])
  # Apply getItem() to each chunk, and merge into one object
  do.call(merge, lapply(symbol.item, getItem))
}
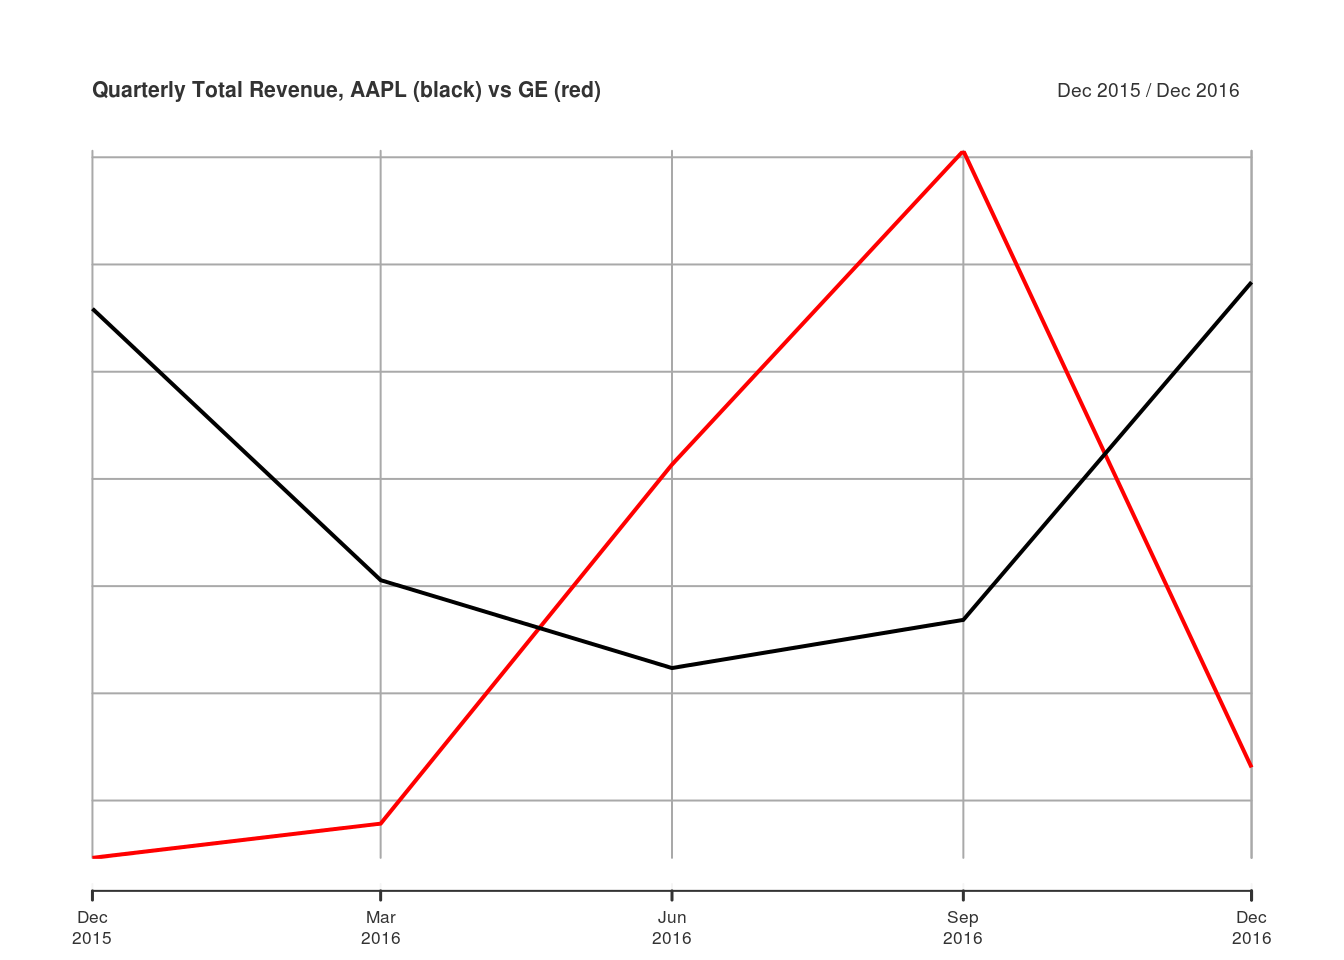
Let’s use extractLineItem() to compare total revenue for GE and AAPL.
totalRevenue <- extractLineItem(Data, "total revenue")
totalRevenue
##          AAPL.Total.Revenue GE.Total.Revenue
## Dec 2015              75872            24654
## Mar 2016              50557            27845
## Jun 2016              42358            61339
## Sep 2016              46852            90605
## Dec 2016              78351            33088
plot(totalRevenue, main = "Quarterly Total Revenue, AAPL (black) vs GE (red)")
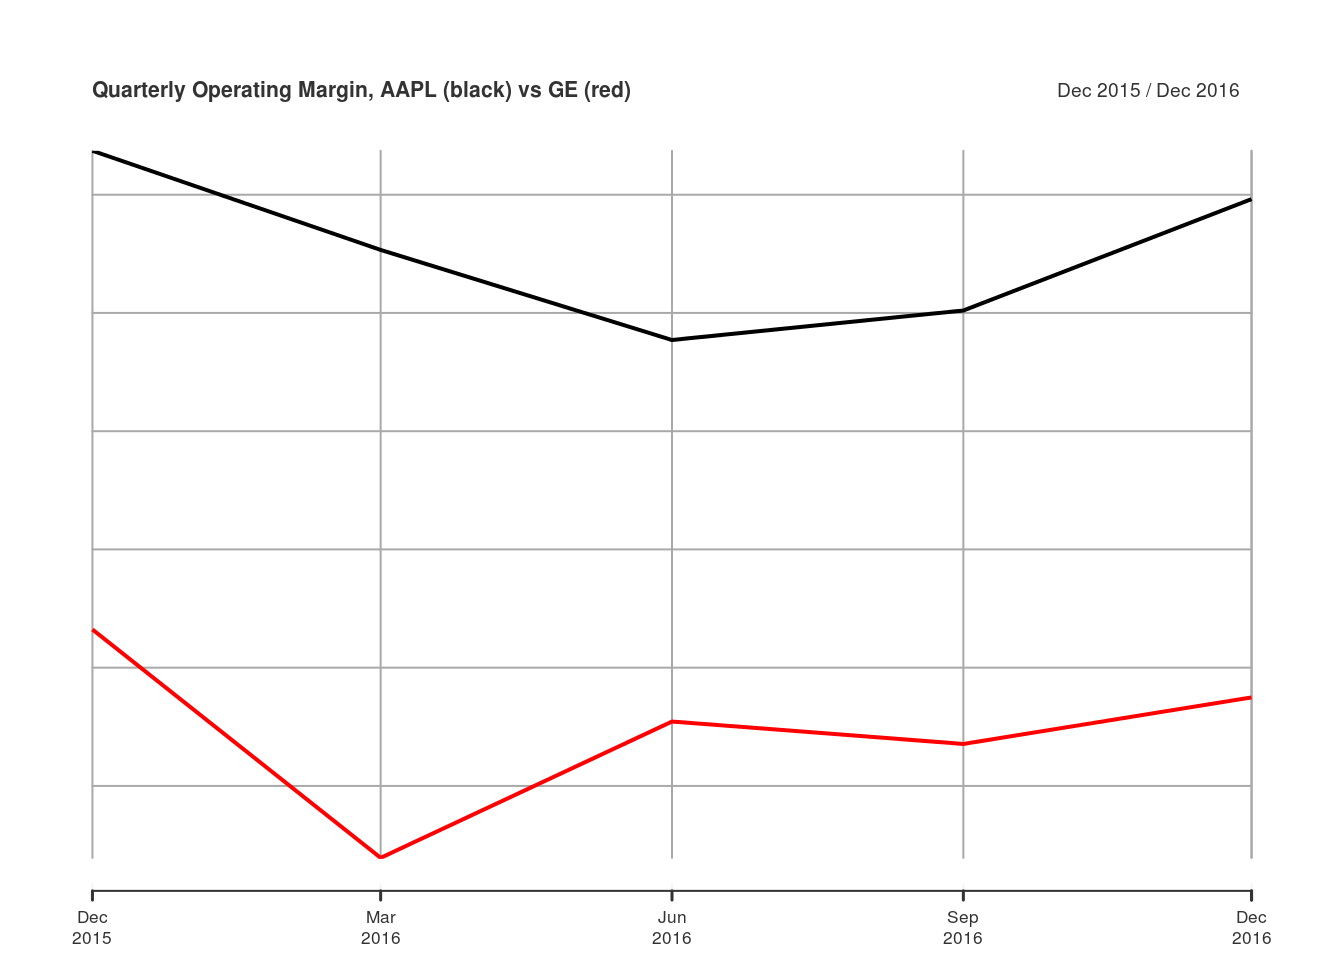
You could also combine multiple calls to extractLineItem() to calculate ratios not included in the output from viewFinancials(). For example, you could divide operating income by total revenue to calculate operating margin.
operatingIncome <- extractLineItem(Data, "operating income")
operatingIncome
##          AAPL.Operating.Income GE.Operating.Income
## Dec 2015                 24171                2863
## Mar 2016                 13987                 545
## Jun 2016                 10105                4736
## Sep 2016                 11761                6138
## Dec 2016                 23359                2892
plot(operatingIncome / totalRevenue, main = "Quarterly Operating Margin, AAPL (black) vs GE (red)")
If you love using my open-source work (e.g. quantmod, TTR, xts, IBrokers, microbenchmark, blotter, quantstrat, etc.), you can give back by sponsoring me on GitHub. I truly appreciate anything you’re willing and able to give!